
Case study
AR Pandemic Visualization Using Spatiotemporal Data
An AR visualization that transforms binary pandemic-model output into a 3D globe, showing a simulated six-month outbreak through work with the Institute for Disease Modeling.
AR Data Visualization · Spatial and Temporal Simulation Data
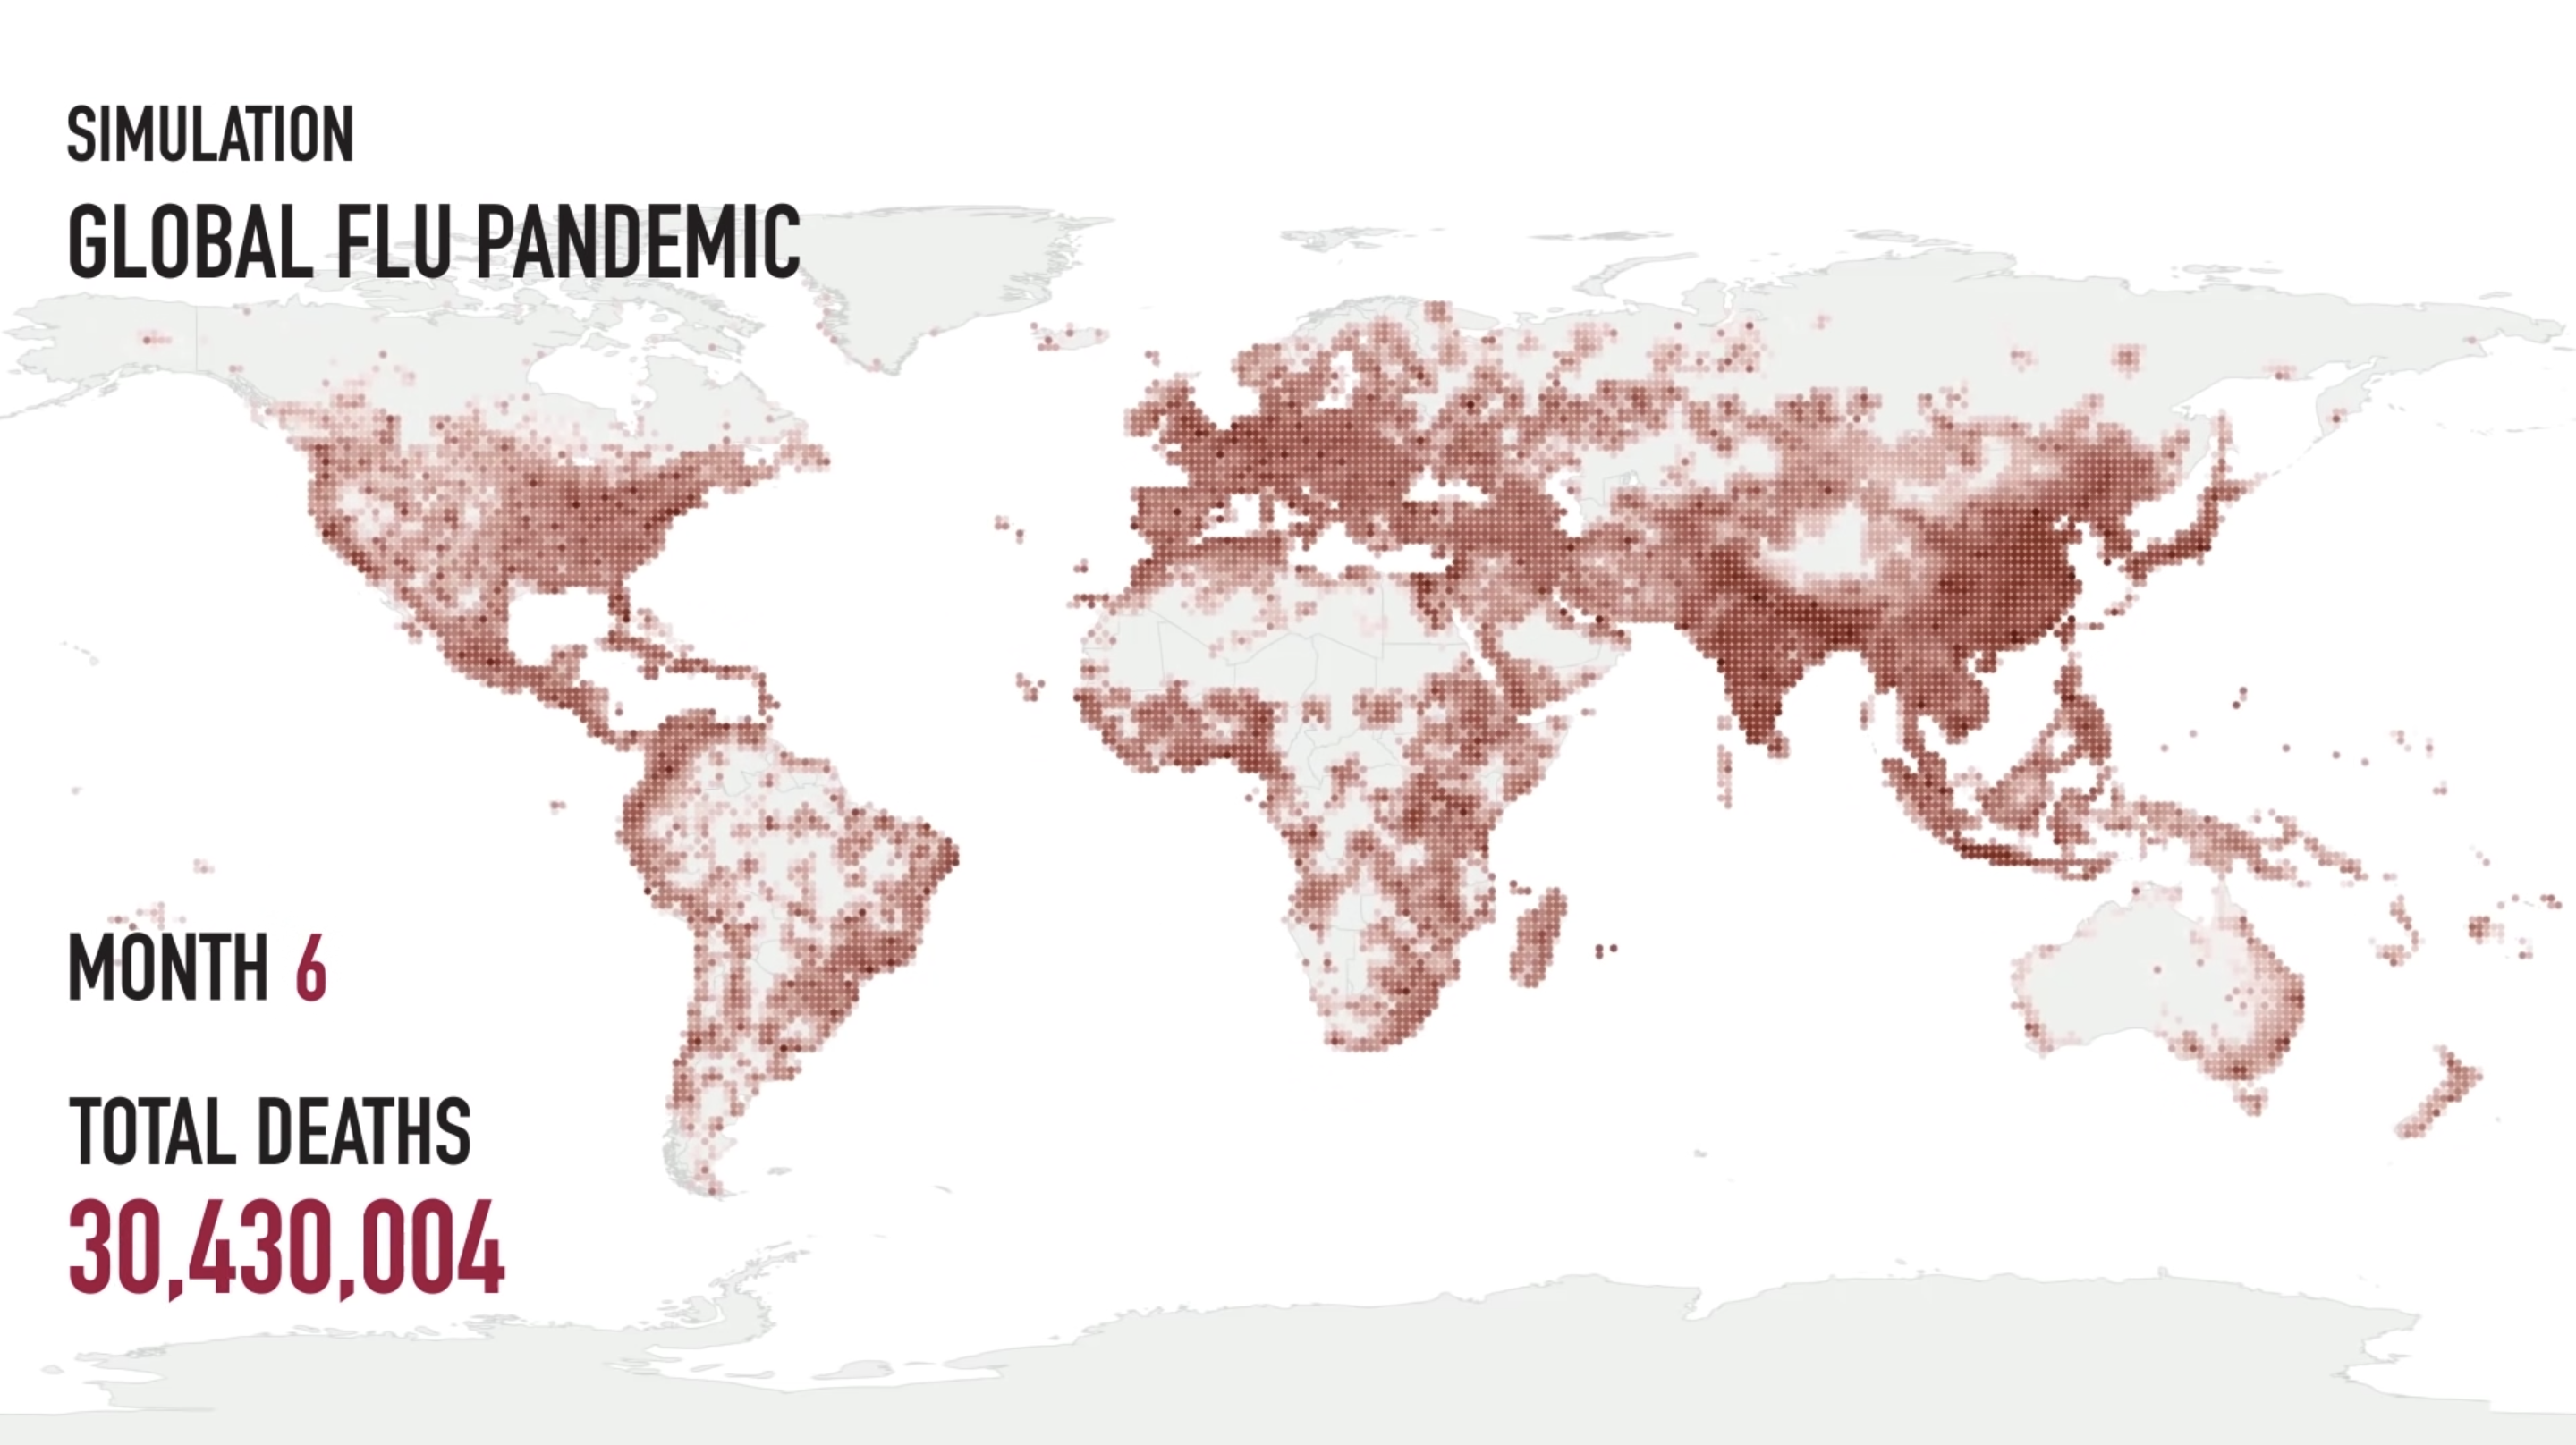
While working on an AR medical application with The Institute for Disease Modeling, I wrote a program that transformed pandemic-model output into a visualization on a 3D globe. The simulation explored how an outbreak resembling the 1918 flu pandemic might spread in a modern setting over six months.
Turning Model Output Into a Spatial View
My contribution was the visualization layer: reading a binary file containing results across locations and time, then mapping that data onto the globe. This made the simulation's geographic spread visible as it progressed.
- Input: Binary output from the predictive model.
- Representation: Geographic data mapped to a 3D globe.
- Experience: An AR view showing the modeled outbreak over time.

The development view shows the spatial distribution of model output at a particular timestep.
Bringing the Simulation Into AR
The application placed the globe into the user's surroundings, with elapsed time and modeled totals accompanying the visualization. The displayed values belong to the simulation scenario; my work focused on presenting those results spatially.

The AR application presents the simulated outbreak on a tabletop globe, with context supplied by the Institute for Disease Modeling.